Your Cloud Is a Graph. Your Security Tools Don't Know That.
- #cloud
- #security
- #open-source
- #graph-database
- #aws
- #iam
- #attack-paths
Srinivas Gowda

The Problem With How We See Infrastructure
Ask a cloud security engineer to describe their AWS environment and they'll pull up a list — EC2 instances, S3 buckets, IAM roles, RDS clusters, neatly organized by service, region, and tag.
Now ask an attacker how they see the same environment. They don't see a list. They see a map.
They see an IAM role assumed by a Lambda function, which has read access to an S3 bucket, which contains credentials for a third-party service, which can write to a production database. They see a path — a chain of trust and permissions that crosses service boundaries, account boundaries, and sometimes cloud boundaries entirely.
The most significant cloud breaches in recent years — Capital One, Uber, Okta's downstream impact — weren't the result of one misconfigured resource. They were the result of attackers traversing a graph of interconnected resources that defenders were looking at as isolated objects.
We have a vocabulary problem in cloud security. We think in resources. Attackers think in relationships.
The Gap Modern Security Tooling Can't Fill
Cloud Security Posture Management (CSPM) tools have become standard issue for serious security teams. They're good at what they do — scanning individual resources against compliance benchmarks, flagging the S3 bucket with public ACLs, the EC2 instance running without encryption, the IAM user without MFA.
But CSPM tools are, by design, resource-centric. They evaluate each asset in isolation against a checklist. The same applies to SIEMs, which aggregate logs but rarely model structural relationships between resources. Even purpose-built IAM analyzers tend to focus on a single service's permission scope rather than the chain of access spanning your entire environment.
The result is a blind spot shaped exactly like the paths attackers take.
CSPM sees:       EC2 instance → attached IAM role → broad permissions  [MEDIUM]

Reality:         EC2 (internet-facing)
                   └─ IAM role
                        └─ sts:AssumeRole → cross-account role (prod)
                                               └─ s3:GetObject → bucket w/ customer PII
                                                                   [BREACH WAITING TO HAPPEN]
A CSPM tool will tell you that an EC2 instance has an attached IAM role with broad permissions. It won't tell you that the instance is internet-accessible, that the IAM role can assume a cross-account role in your production account, and that the target role has `s3:GetObject` on a bucket containing customer PII. Each finding in isolation might be rated medium severity. Together, they're a breach waiting to happen.
No amount of dashboard tuning changes this. The problem isn't data — it's the data model.
Enter Cartography: Infrastructure as a Graph
Cartography is an open-source project under the Cloud Native Computing Foundation (CNCF) that takes a fundamentally different approach. Instead of scanning resources against rules, it ingests your entire cloud environment — across AWS, GCP, Azure, Kubernetes, Okta, GitHub, and 40+ other integrations — and stores everything in a graph database.

Every resource becomes a node. Every relationship becomes an edge. The result is a queryable, traversable map of your infrastructure that reflects not just what exists, but how things are connected.
Cartography's integrations span the full breadth of modern cloud infrastructure:
| Category | Integrations |
|---|---|
| Cloud | AWS (50+ services), GCP, Azure, Oracle Cloud, DigitalOcean, Scaleway |
| Identity | Okta, Microsoft Entra ID, Keycloak, Google Workspace, AWS Identity Center, Duo |
| DevOps | Kubernetes, GitHub, GitLab, Spacelift, Airbyte |
| Security | CrowdStrike Falcon, SentinelOne, Semgrep, Docker Scout, NIST CVE |
| SaaS | Slack, PagerDuty, Cloudflare, Tailscale, Jira, Sentry |
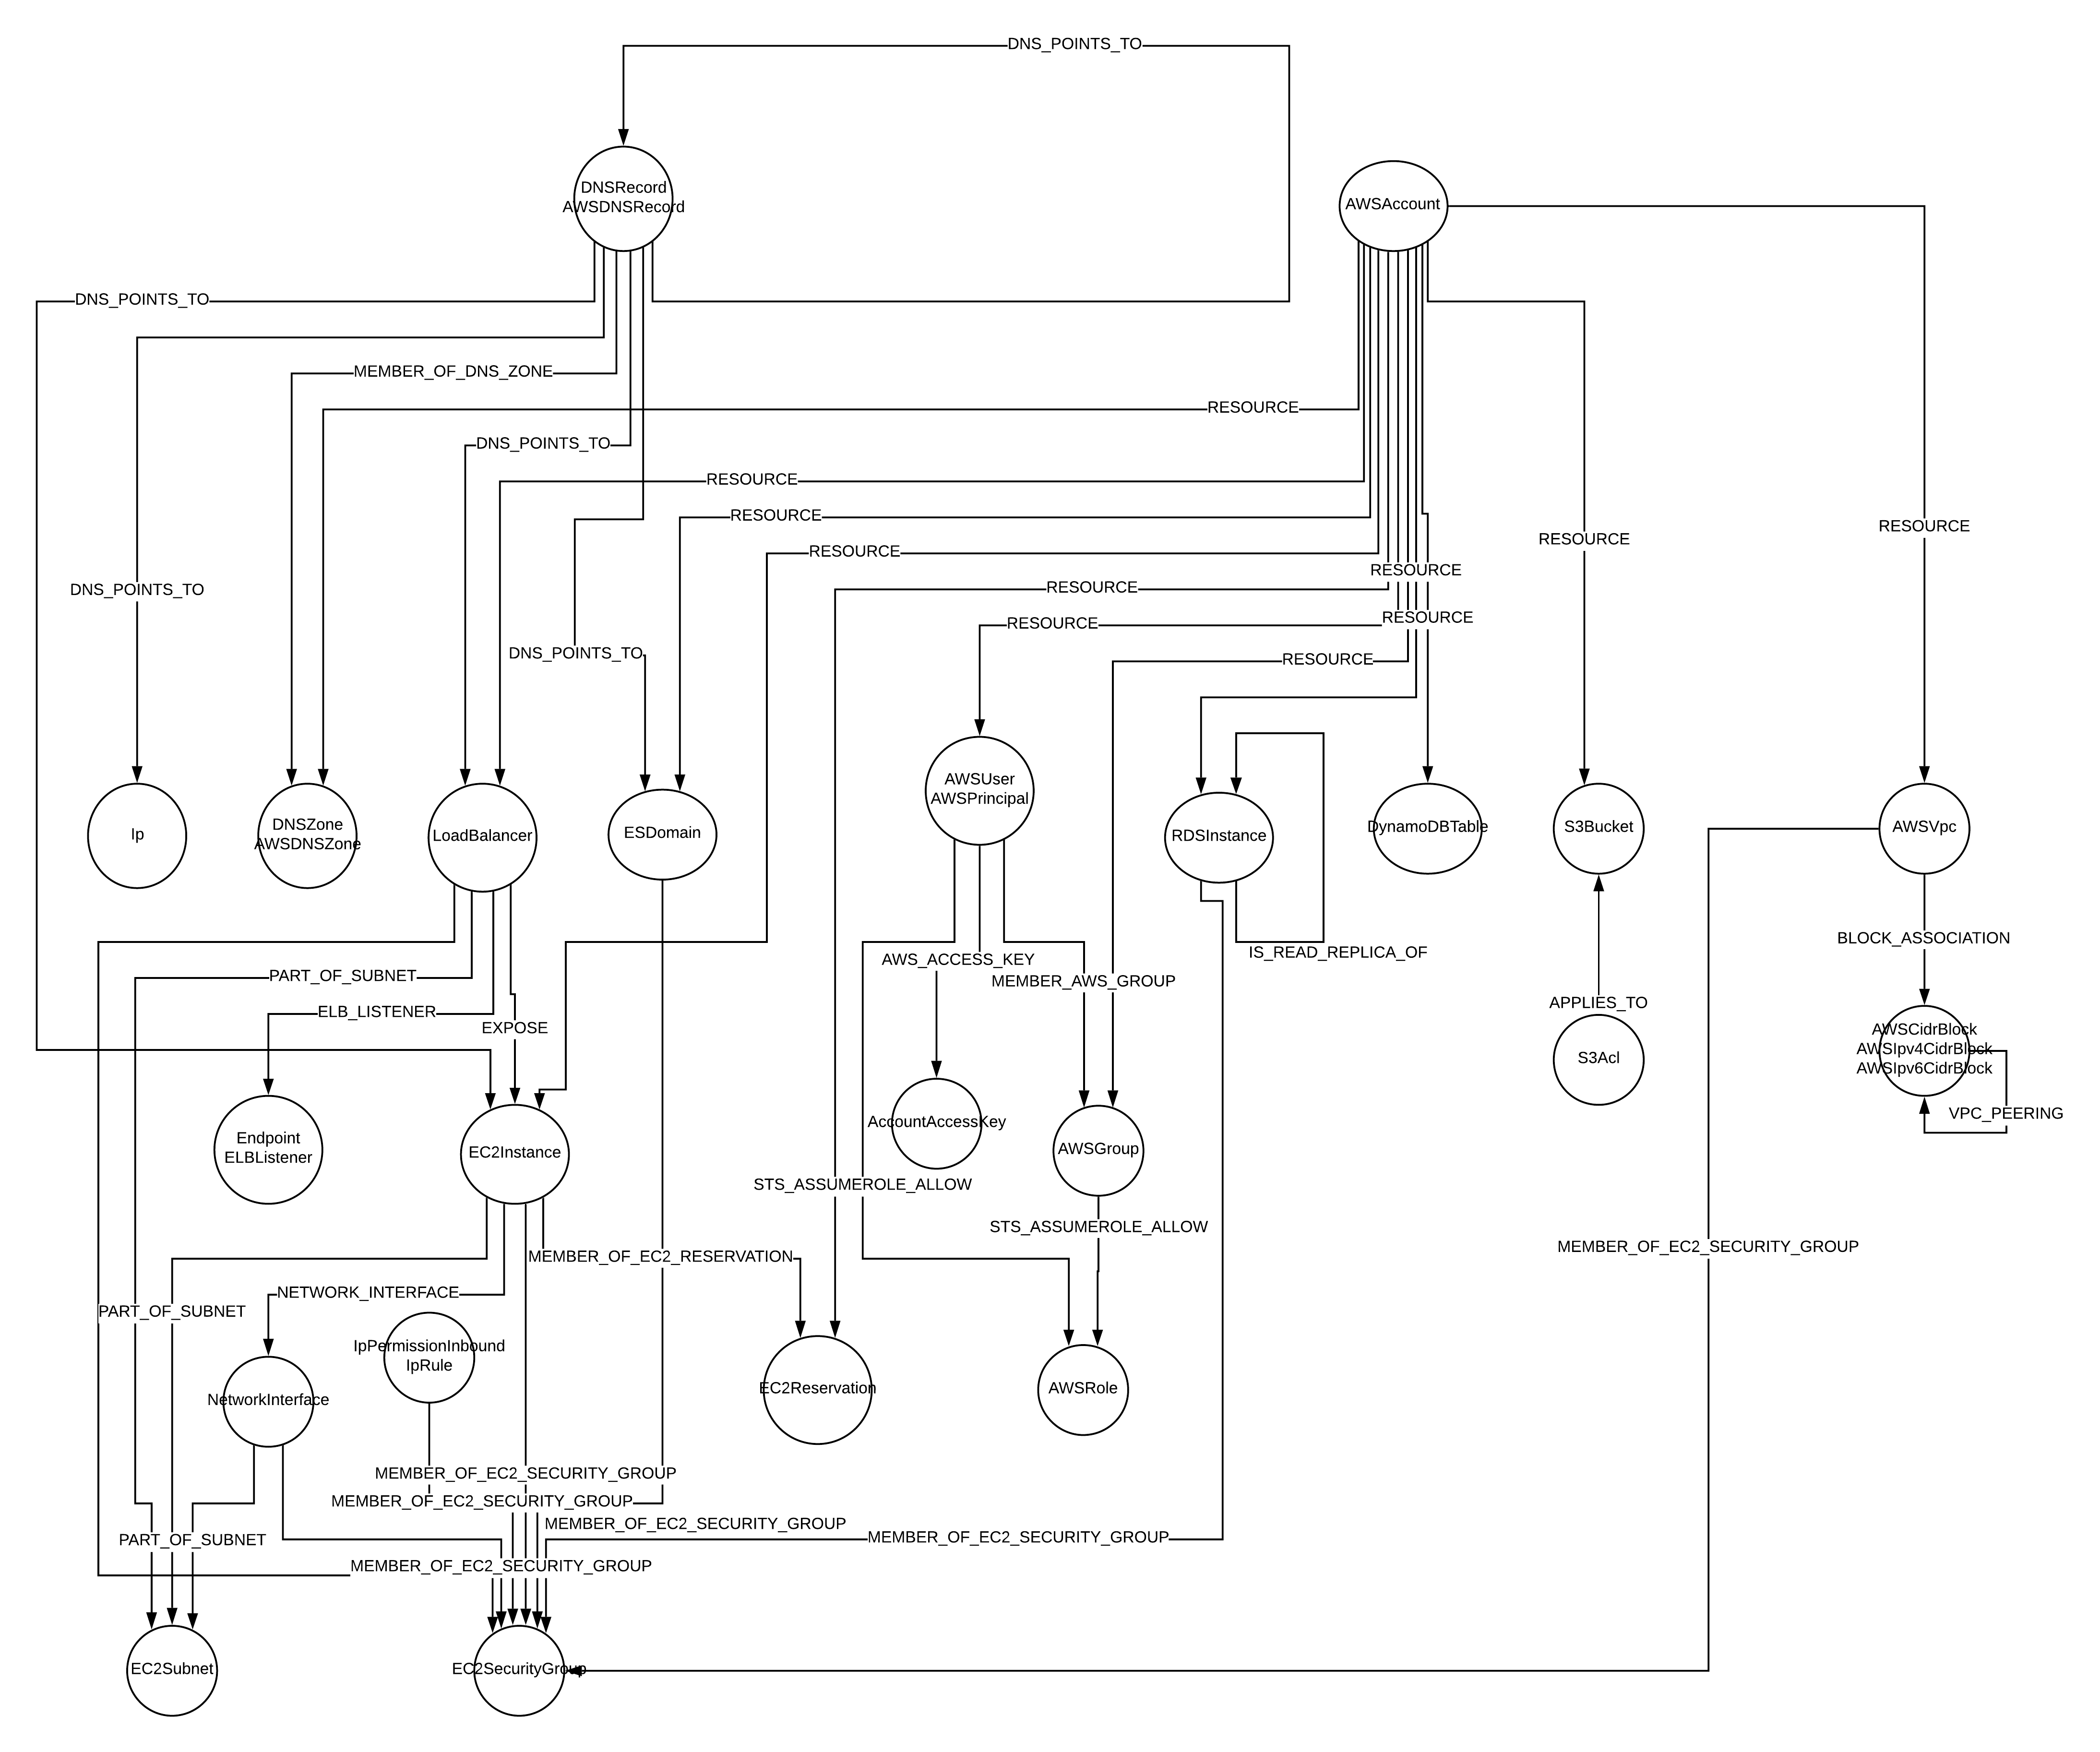
This isn't a visualization layer on top of existing data. It's a new data model for your infrastructure, purpose-built for relationship queries.
How It Works
The Sync Pipeline
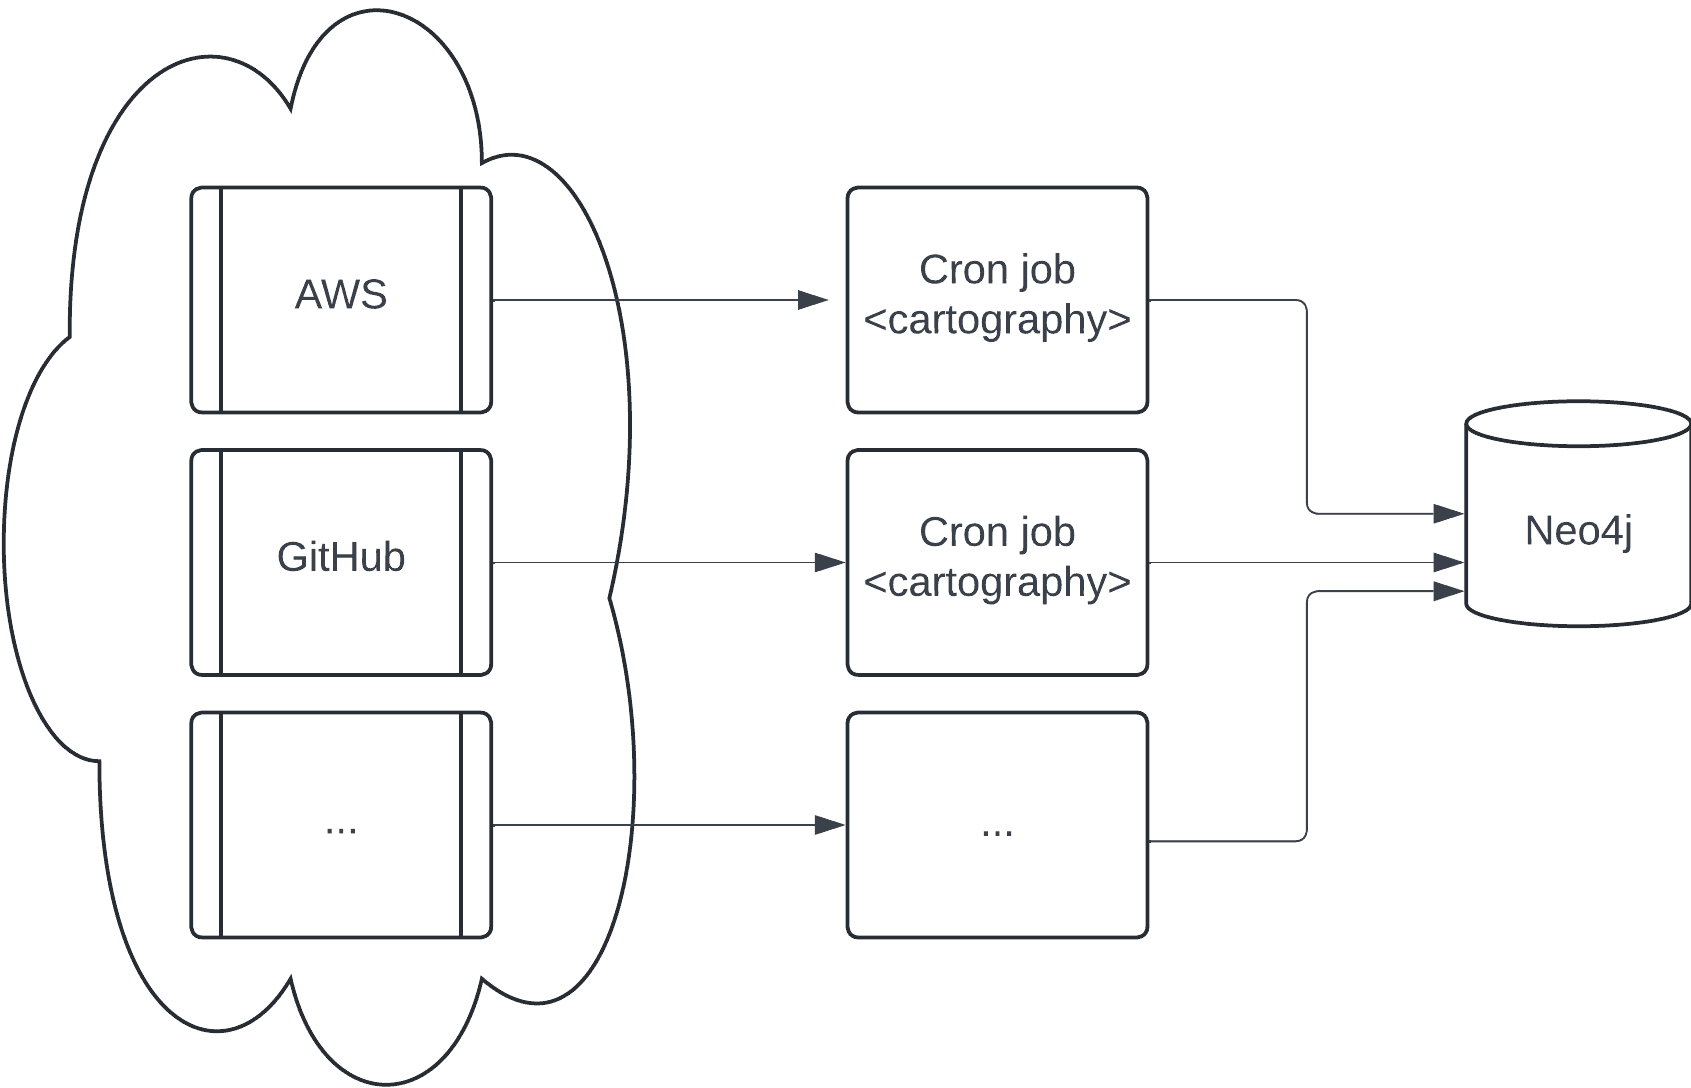
Cartography runs as a sync process — typically on a scheduled interval — pulling data from cloud provider APIs using your existing credentials (IAM roles, OAuth tokens) and writing to a Neo4j graph database.
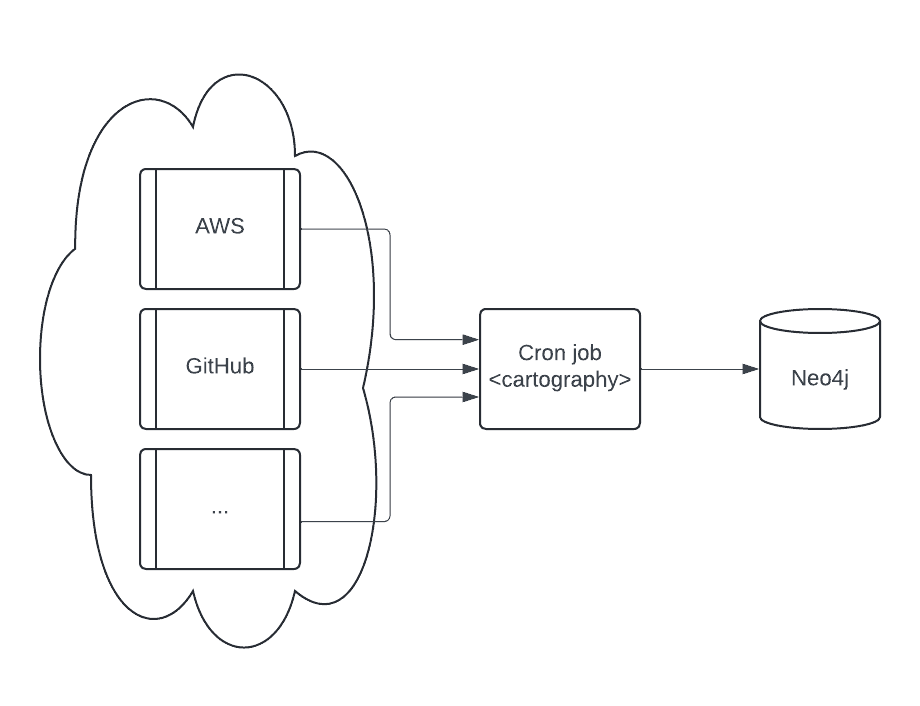
The ingestion pipeline has four stages:
- Intel modules call provider APIs and return structured data
- Schema definitions declare how data maps to graph nodes and what relationships to create
- Graph jobs execute parameterized Cypher queries to write nodes and edges to Neo4j using
`MERGE`semantics — ensuring idempotent, safe updates - Cleanup jobs remove stale nodes from prior sync runs, so the graph always reflects current state
The schema-driven approach is worth highlighting. Each resource type — say, `EC2Instance` — has a declarative model that defines its properties, which fields to index, and what relationships to create. Adding a new resource type means defining its schema, not writing raw query logic. This makes the system extensible and maintainable at scale. For large environments, different providers run in separate parallel jobs to avoid race conditions on shared graph state.
Resources Become Nodes, Relationships Become Edges
Consider a simplified slice of your AWS environment. After a sync, the graph contains:
(AWSAccount)
  -[:RESOURCE]-> (EC2Instance)
    -[:INSTANCE_PROFILE]-> (AWSInstanceProfile)
      -[:ASSOCIATED_WITH]-> (AWSRole)
        -[:POLICY]-> (AWSPolicy)
          -[:STATEMENT]-> (AWSPolicyStatement { effect: "Allow", action: ["s3:*"] })

(EC2Instance) -[:MEMBER_OF_EC2_SECURITY_GROUP]-> (EC2SecurityGroup)
(EC2SecurityGroup) <-[:MEMBER_OF_EC2_SECURITY_GROUP]- (IpPermissionInbound)
  <-- (IpRange { range: "0.0.0.0/0" })
Every hop is a traversable edge. That instance is internet-accessible (via the `0.0.0.0/0` IP range) and carries a role with `s3:*` permissions. These two facts, connected in the same graph, reveal the attack path. Connected in separate dashboards, they're just two medium-severity findings.
Permission Modeling: MatchLinks
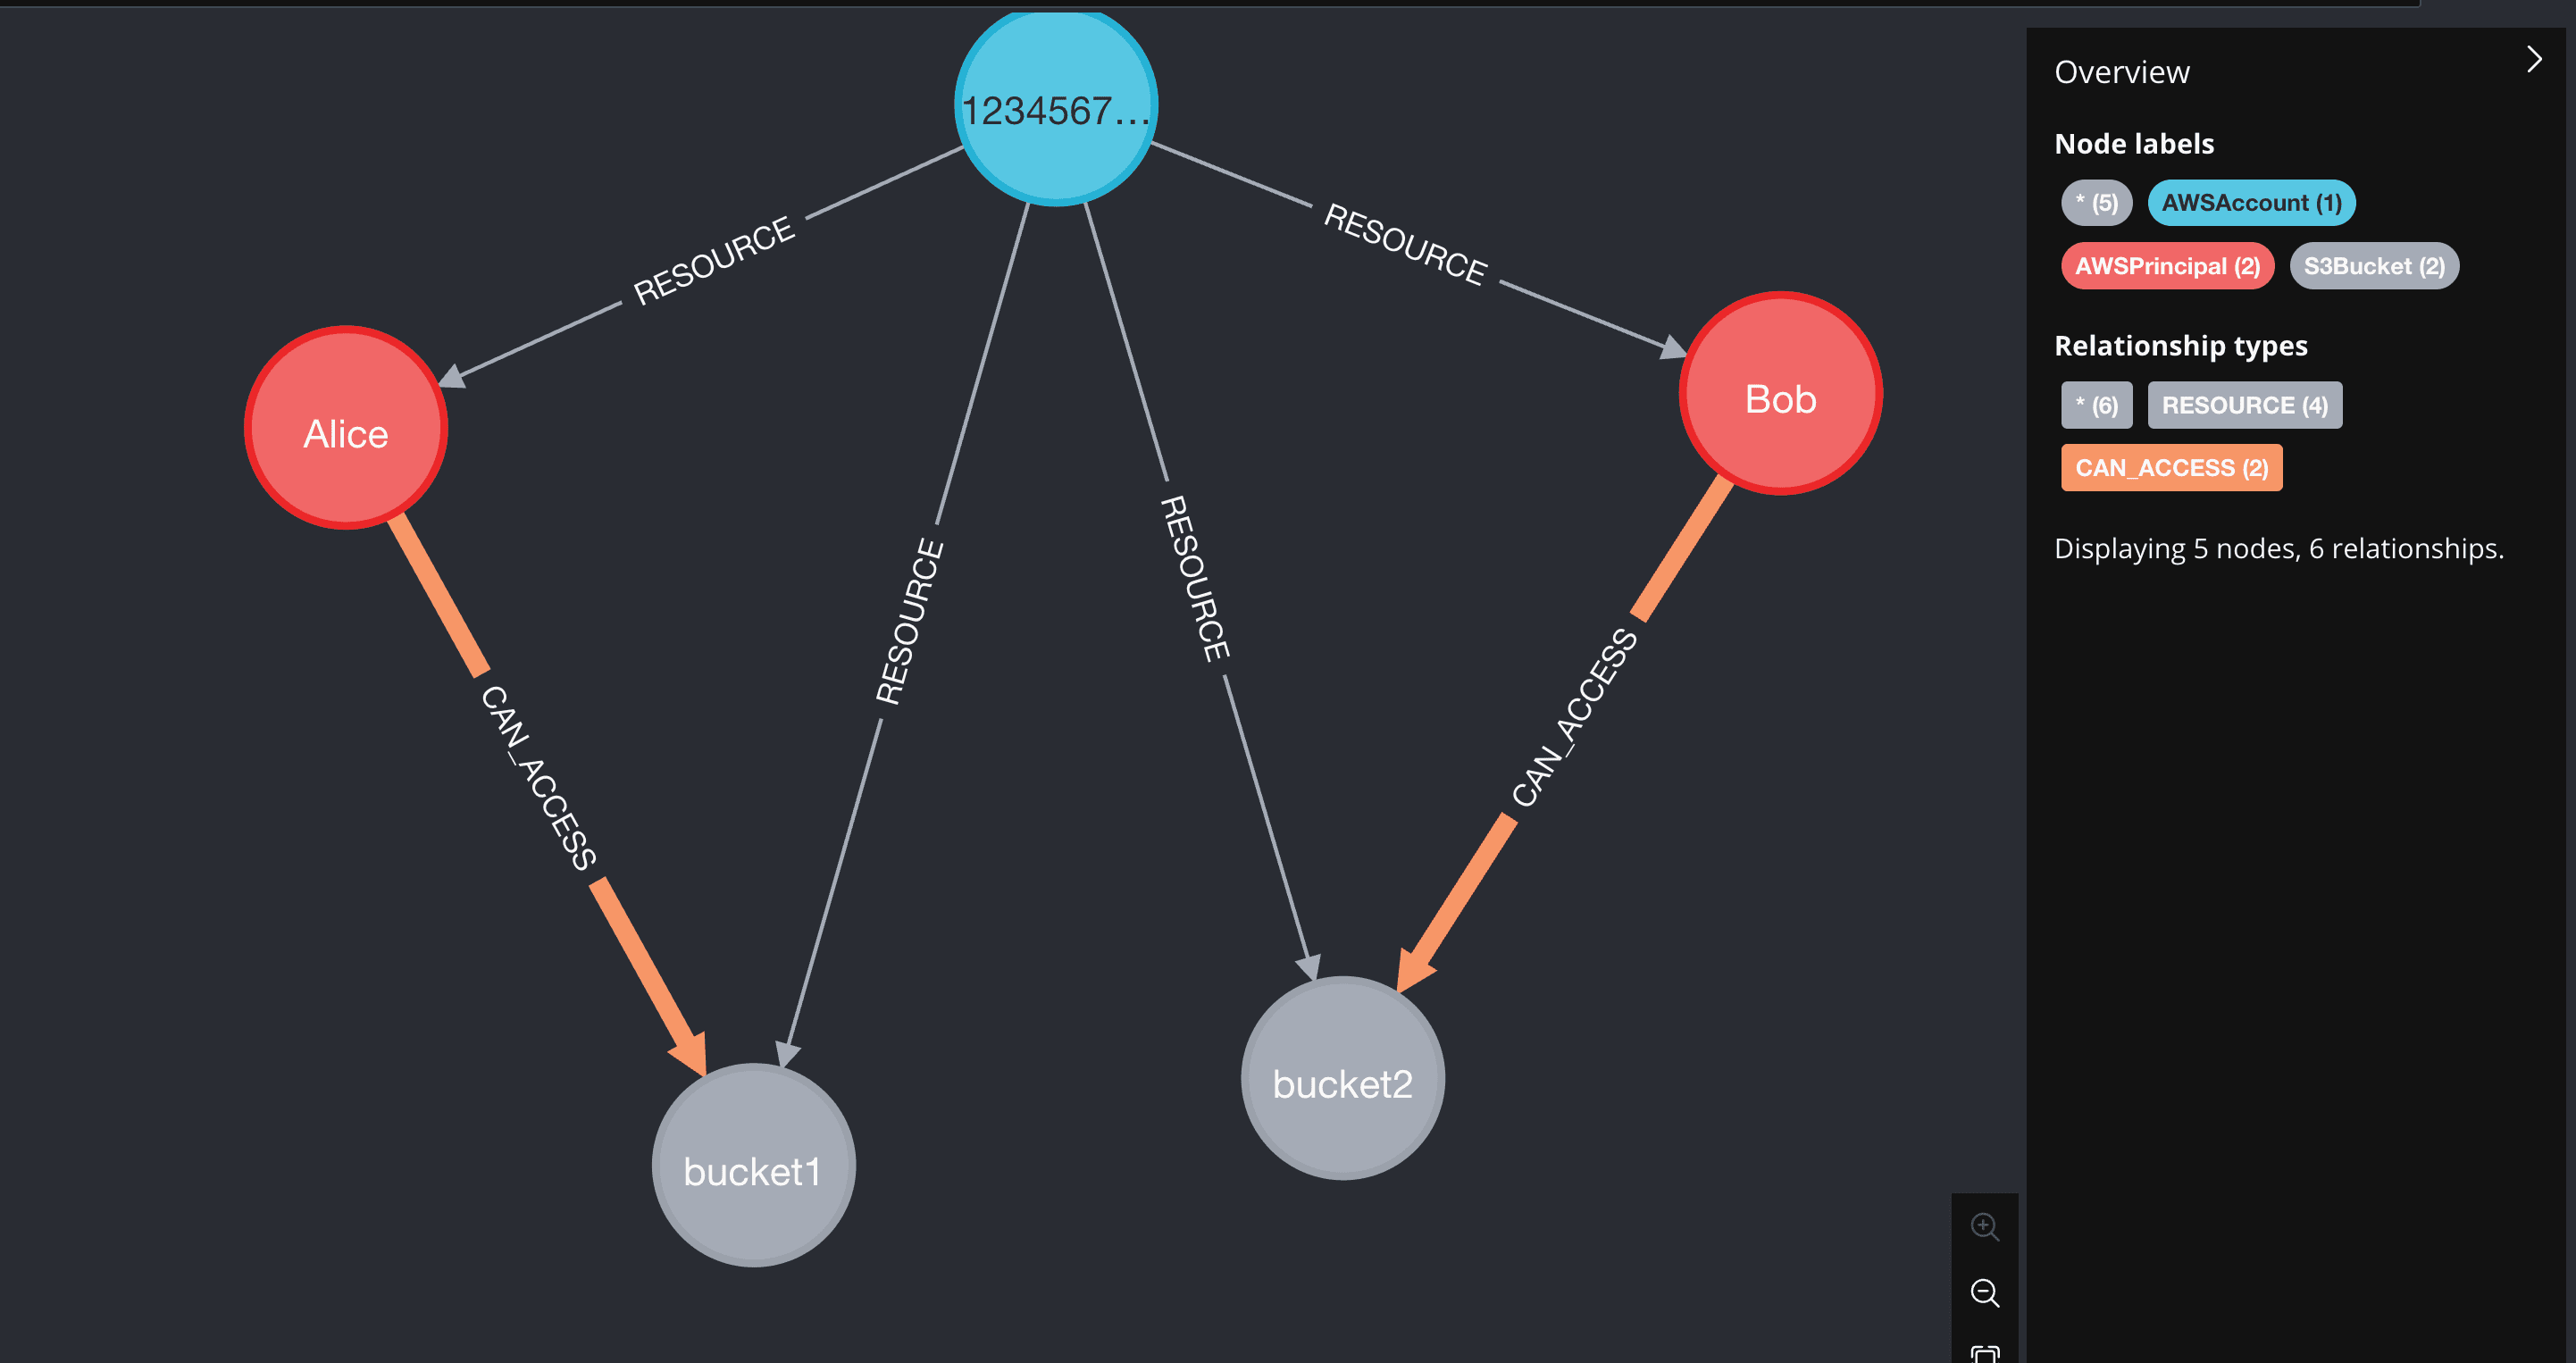
One of Cartography's most powerful primitives for IAM analysis is MatchLinks — a declarative way to model which principals can access which resources based on policy statements. MatchLinks connects users and roles to the resources their policies permit access to, turning abstract policy documents into traversable graph edges. This means you can ask "who can read this bucket?" and get an answer that accounts for every indirect path — group memberships, role assumptions, and resource-based policies alike.
Queries That Change How You Think About Security
Once your infrastructure lives in a graph, the questions you can ask change entirely. These aren't canned reports — they're ad-hoc traversals of a live model of your infrastructure.
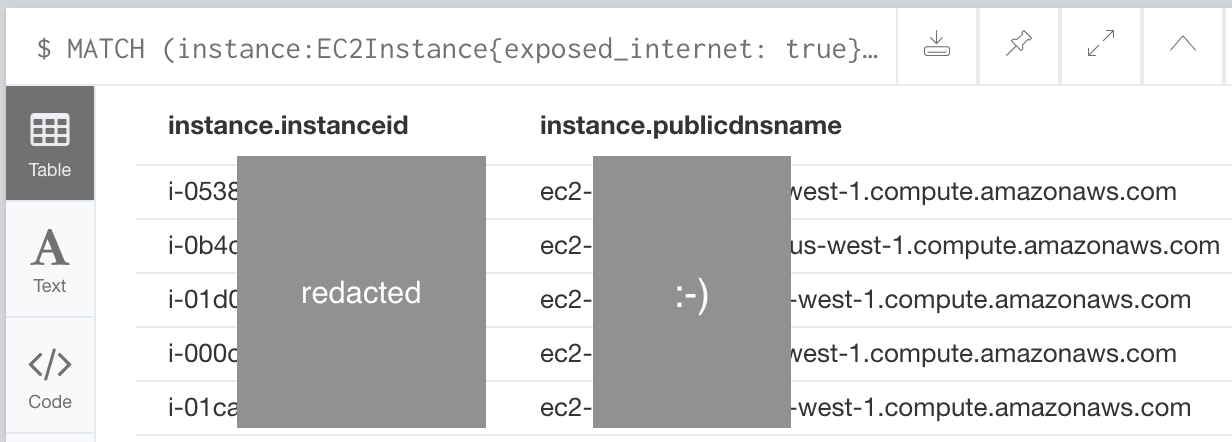
Find publicly exposed EC2 instances
MATCH (instance:EC2Instance {exposed_internet: true})
RETURN instance.instanceid, instance.publicdnsname, instance.iaminstanceprofile
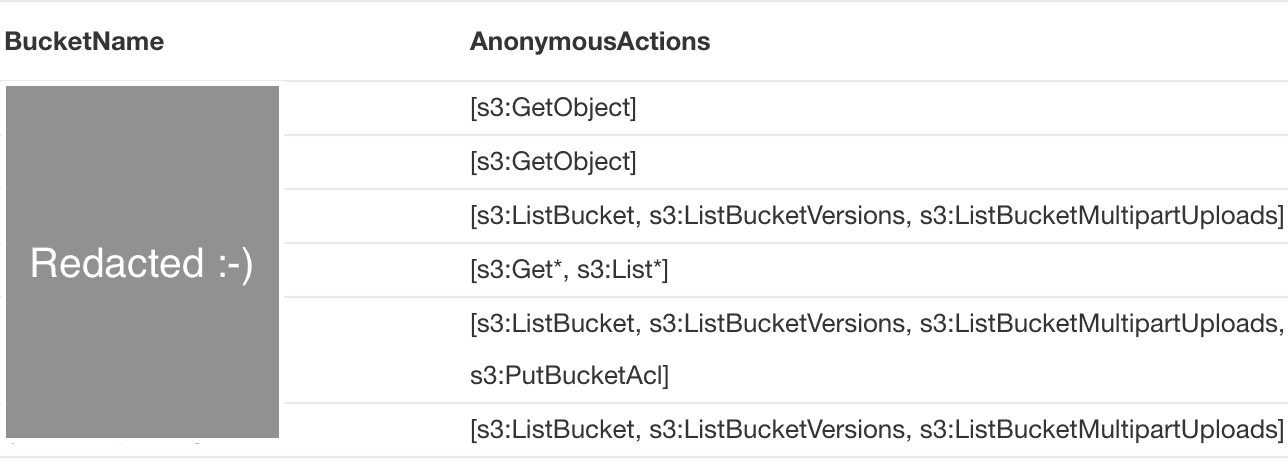
Find S3 buckets granting anonymous access
MATCH (s:S3Bucket)
WHERE s.anonymous_access = true
RETURN s.name, s.region, s.creationdate
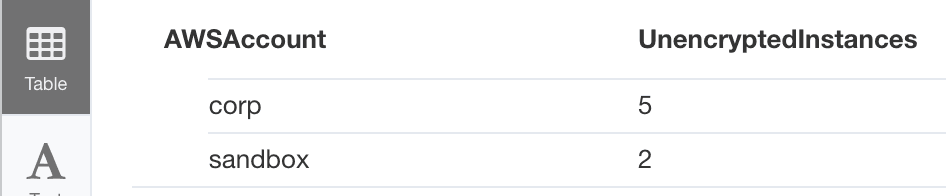
Find unencrypted RDS instances, grouped by account
MATCH (a:AWSAccount)-[:RESOURCE]->(rds:RDSInstance)
WHERE rds.storage_encrypted = false
RETURN a.name AS AWSAccount, count(rds) AS UnencryptedInstances
ORDER BY UnencryptedInstances DESC
Map privilege escalation paths — roles that can delete IAM policies
MATCH (stmt:AWSPolicyStatement)--(pol:AWSPolicy)--(principal:AWSPrincipal)--(acc:AWSAccount)
WHERE stmt.effect = "Allow"
AND any(x IN stmt.action WHERE x = "iam:DeletePolicy")
RETURN principal.arn, acc.name
Trace Identity Center users to the AWS accounts they can reach
MATCH (user:AWSSSOUser {user_name: "engineer@example.com"})
    <-[:ALLOWED_BY]-(role:AWSRole)
    <-[:RESOURCE]-(account:AWSAccount)
MATCH (role)<-[:ASSIGNED_TO_ROLE]-(ps:AWSPermissionSet)
RETURN account.name, role.arn, ps.name
Built-In Security Rules
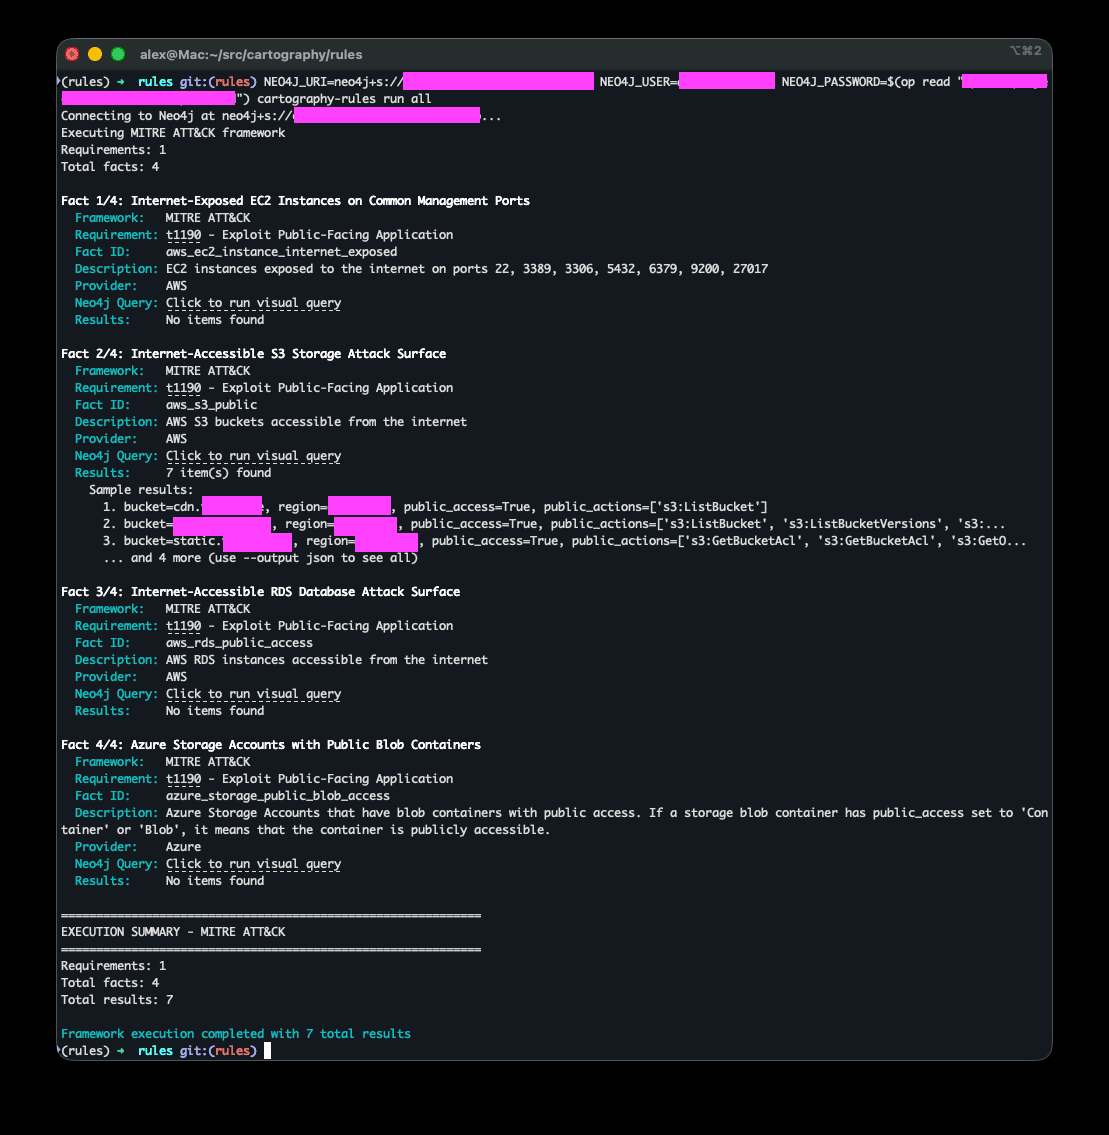
Beyond ad-hoc queries, Cartography ships with a rules engine that runs automated security checks as post-processing analysis jobs. Each rule is a Cypher query stored as a JSON file that annotates nodes directly in the graph with findings.
cartography-rules run all
This is a meaningful distinction from alert-based tools. Because findings are written back into the graph, a flagged EC2 instance can be immediately contextualized: which account owns it, what IAM role it carries, what S3 buckets that role can reach. You get context, not just alerts.
Why This Matters: Defenders Need to Think Like Attackers
The security industry talks a lot about "shifting left" and "defense in depth." What gets talked about less is shifting perspective — from resource-centric to relationship-centric thinking.
Attackers use tools like BloodHound (originally built for Active Directory attack paths) that treat identity and access as a traversal problem. The question isn't "does this role have admin permissions?" It's "starting from this compromised credential, what can I reach in 3 hops?"
Cartography brings that same model to cloud infrastructure defense. Security posture isn't a property of individual resources — it's a property of the relationships between them. A perfectly configured S3 bucket connected to an overprivileged, internet-exposed role is not a secure S3 bucket.
Graph-based visibility improves security across every phase of operations:
- Proactive security — enumerate attack paths before they're exploited
- Incident response — instantly scope blast radius when a credential is compromised
- Compliance auditing — answer "who has access to what" with traversal, not spreadsheets
- Change management — detect drift between sync runs using
`firstseen`/`lastupdated`timestamps
Real-World Attack Path Scenarios
Scenario 1 — The Overprivileged Lambda
A Lambda deployed for a dev workflow has an IAM role with `s3:*` permissions, invoked via an unauthenticated API Gateway endpoint. Individually, neither finding is critical. Together, they're an unauthenticated path to arbitrary S3 access. A Cartography query traversing `APIGateway → Lambda → IAMRole → S3Bucket` surfaces this chain in seconds.
Scenario 2 — Cross-Account Blast Radius
An EC2 instance in a dev account is compromised. The attacker retrieves credentials from the metadata service, assumes a cross-account role into production, and reaches customer data. Cartography models `STS_ASSUMEROLE_ALLOW` as a first-class relationship — letting you enumerate blast radius before an incident, not after.
// Starting from a compromised instance, where can an attacker reach?
MATCH (instance:EC2Instance {instanceid: "i-0abc123"})
      -[:INSTANCE_PROFILE]->()-[:ASSOCIATED_WITH]->(role:AWSRole)
      -[:STS_ASSUMEROLE_ALLOW]->(target:AWSRole)
      <-[:RESOURCE]-(targetAccount:AWSAccount)
RETURN instance.instanceid, role.arn, target.arn, targetAccount.name
Scenario 3 — The Orphaned Access Key
An IAM user created for a deprecated CI/CD pipeline still has an active access key and membership in an `Administrators` group. No one remembers it exists. Cartography tracks `firstseen` and `lastupdated` timestamps on every node — a query filtering on users with stale keys attached to high-privilege groups finds these orphans automatically, without waiting for an alert.
MATCH (u:AWSUser)-[:MEMBER_OF]->(g:AWSGroup {name: "Administrators"})
MATCH (u)-[:HAS_ACCESS_KEY]->(k:AWSAccessKey {status: "Active"})
WHERE datetime(k.lastupdated) < datetime() - duration("P90D")
RETURN u.name, k.accesskeyid, k.lastupdated
Build Applications and Dashboards on Top
Cartography isn't just a query tool — it's a platform. Teams have built security dashboards, automated ticketing pipelines, and compliance reporting directly on top of the graph.
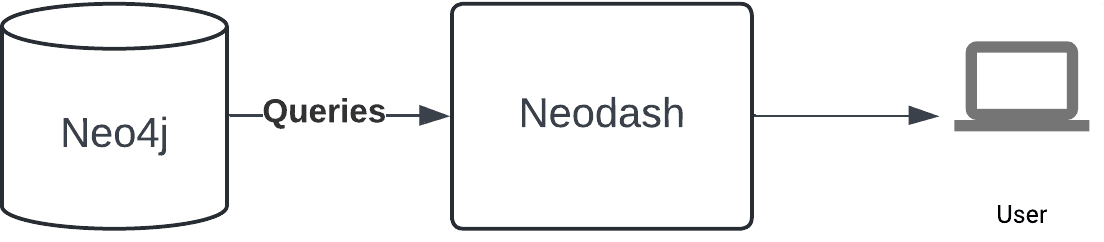
Two common architectural patterns emerge in practice. The first is an API layer that abstracts the graph behind purpose-built endpoints — e.g., `/blast-radius?role=arn:...` — so product and engineering teams can consume security data without writing Cypher. The second is a live dashboard built with a tool like Neodash (Neo4j's native dashboard layer), giving security teams a fully customizable, relationship-aware view of their posture that updates with every sync.
Both patterns share a key property: findings come with their full graph context, not just a resource ID and a severity score.

Graph-Based Security Is Where Cloud Security Is Heading
The trajectory of cloud environments is clear. Environments are getting more complex — more accounts, more services, more cross-cloud integrations, more third-party SaaS with deep IAM access. The attack surface isn't growing linearly; it's growing combinatorially, because every new relationship is a potential pivot point.
Static compliance checks will always have a role. But they're a floor, not a ceiling. The teams that catch sophisticated attacks early are the ones who can answer:
"Given what just happened, what else could the attacker reach?"
That question requires a graph.
Cartography's recent additions — EC2 IMDSv2 enforcement tracking, AWS Identity Center full mapping, Semgrep secrets integration, Kubernetes cluster modeling — reflect an ecosystem moving toward unified visibility across the entire software supply chain, not just cloud infrastructure.
Getting Started
If you're a cloud engineer thinking about security architecture, a security engineer trying to quantify blast radius, or a technical founder deciding how to build a security program from the ground up — the highest-leverage thing you can do is model your infrastructure as a graph.
Cartography makes that tractable. It's open source, runs against your existing cloud credentials, and you can be up and running in under 30 minutes with Docker:
# Clone the repo
git clone https://github.com/cartography-cncf/cartography.git
cd cartography

# Start Neo4j + Cartography with Docker Compose
docker compose up
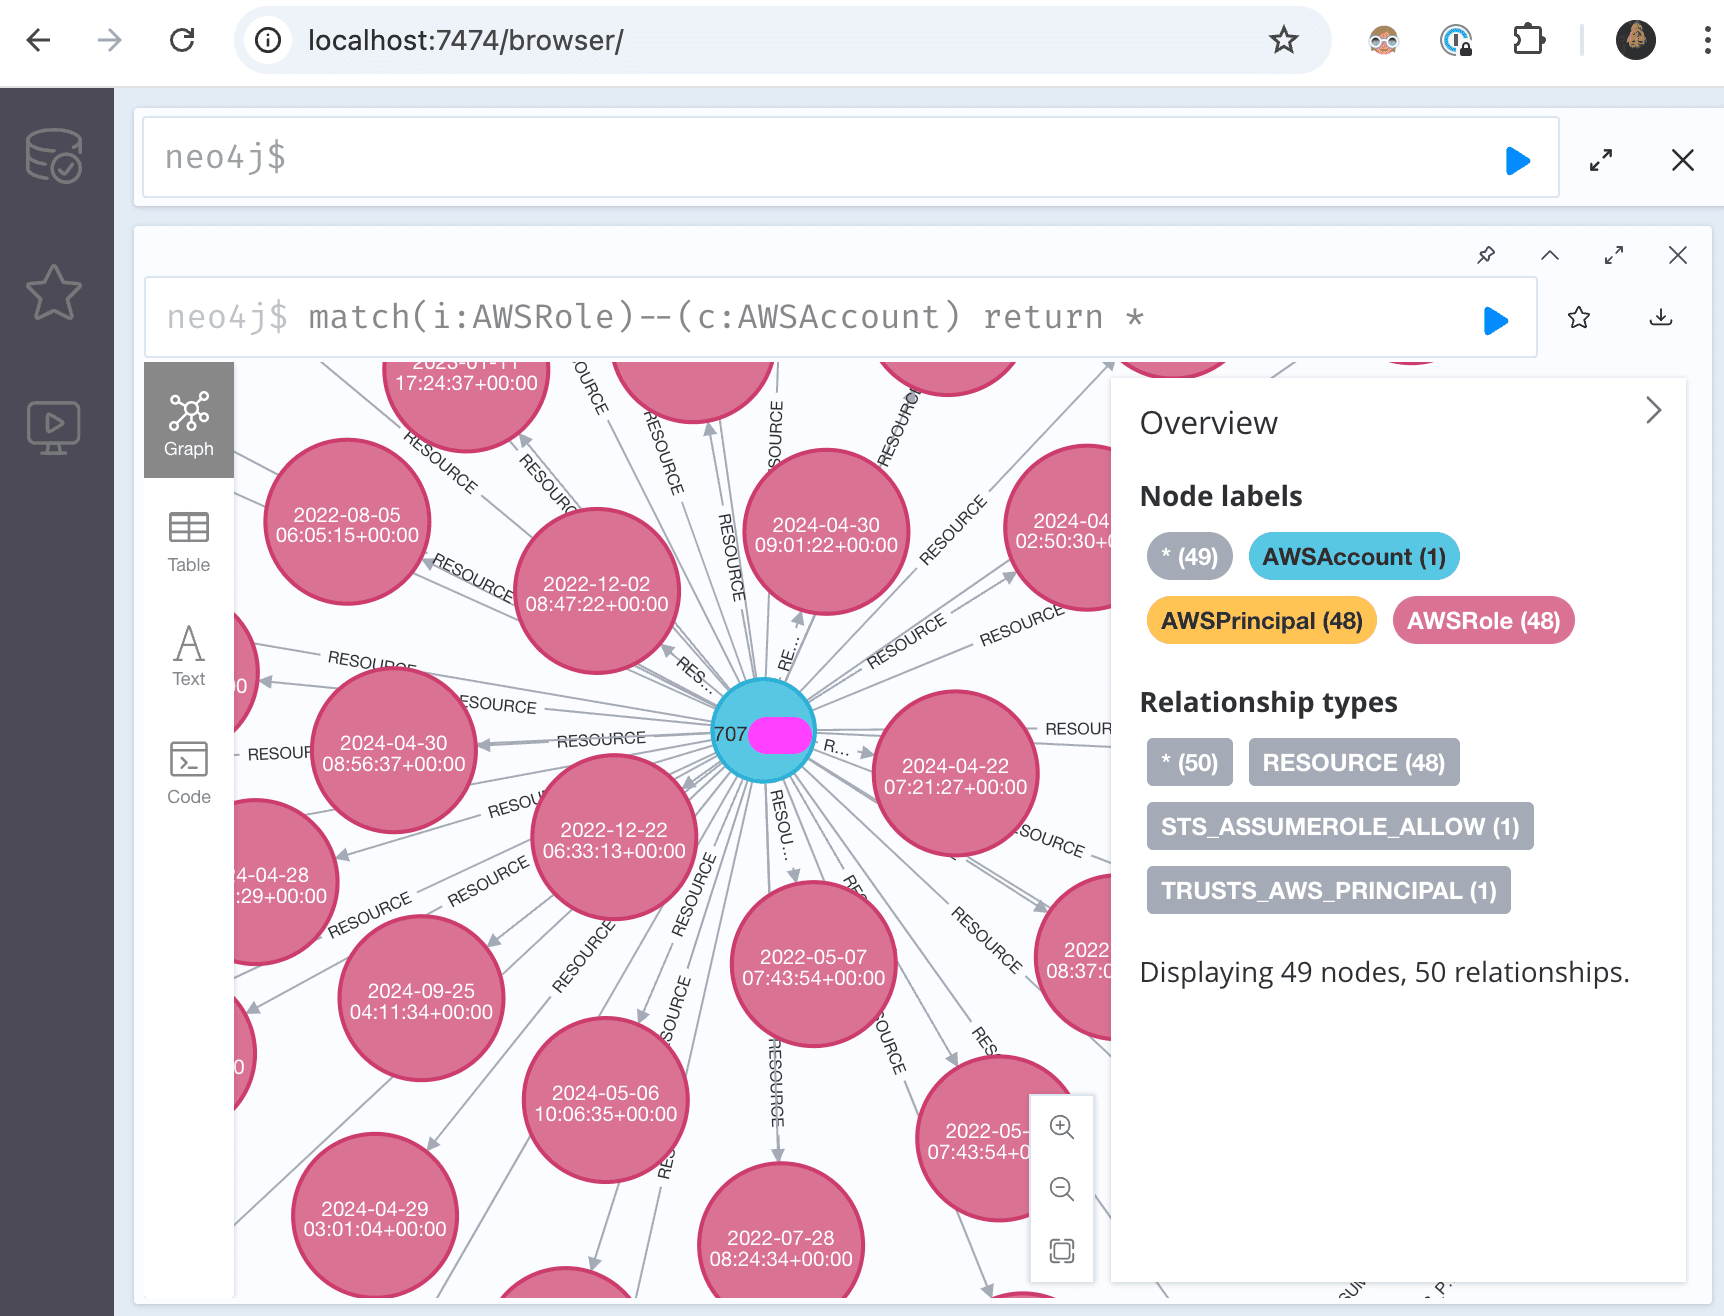
Then open your Neo4j browser at `http://localhost:7474` and run your first query:
MATCH (role:AWSRole)--(account:AWSAccount)
RETURN *
The first query that surfaces a real attack path in your environment will make the setup cost feel negligible.
Start at github.com/cartography-cncf/cartography. Deploy Neo4j. Run your first sync. Then ask the question your current tools can't answer.
Note: Cartography is a CNCF Sandbox project. All Cypher queries shown are illustrative examples based on the project's documented query patterns.